
In this article, I’ll be your guide through the process of setting up syslog forwarding from a SonicWALL firewall to a Wazuh SIEM, finely tuning the system by modifying rulesets and alerting configurations, and visualizing the data for actionable insights. By establishing this comprehensive pipeline, you’ll gain the ability to effectively monitor and analyze network traffic, which in turn will bolster the security of your infrastructure. This guide was written in SonicOS 6 and Wazuh v4.7.3 deployed on-premises. So, let’s dive in…
Why do this? Well, let’s look how it helped me identify potential threats!
After completing all of the steps I outlined in this article, I let my test infrastructure run for a few days to get a baseline, and determine false positives. As you can see in the visualizations below, in my test environment I observed 631 instances of an IP address with a specific Geo Location attempting something on my SonicWALL firewall. Let’s dive deeper into this…

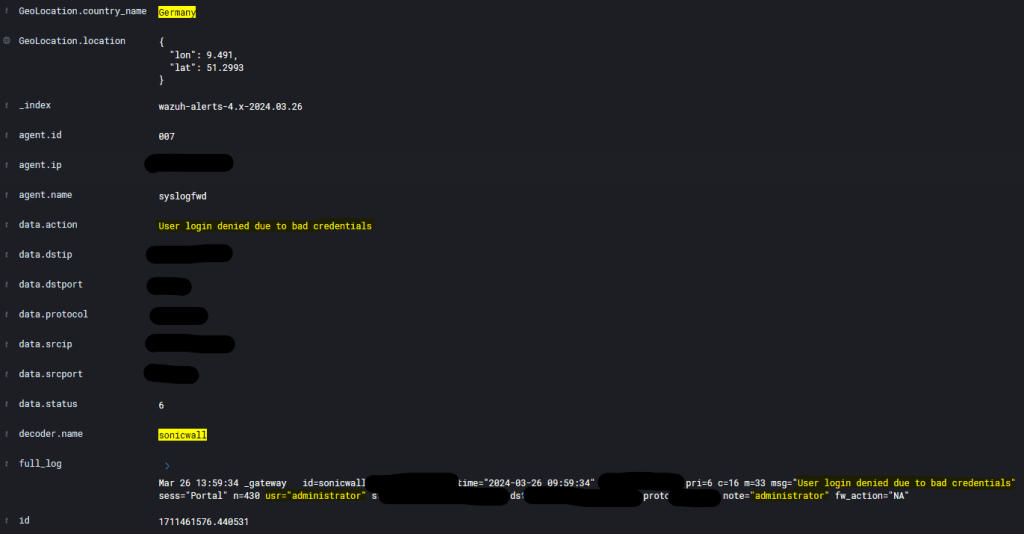
- I ran a query in the OpenSearch Dashboard Discover tab, narrowing down the results to
decoder.nameas “sonicwall” andGeoLocation.country_nameas the identified country name appears on the heatmap. - Upon investigation, I discovered that a “user” was attempting to log in with non-existent or incorrect credentials to a publicly facing login page for my SSLVPN service, and attempted it 631 times over the course of a few weeks.
To mitigate the identified threats and reduce the risk of unauthorized access, I implemented serval extra security measure to ensure this joker continues to waste his time!!
So, by leveraging syslog forwarding, threat map visualization, and conducting targeted queries, I was able to identify and investigate potential malicious activity originating from specific geographical locations. By following this guide, you’ll also be better equipped to identify potential threats to your systems!
PART 1: SETTING UP SYSLOG FORWARDING
Step 1: Create an Address Object on SonicWALL
- Access your SonicWALL HTTPS management page.
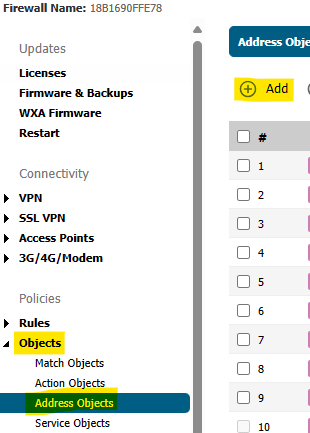
- Navigate to Manage > Objects > Address Objects.
- Click on Add to create a new Address Object.


- Provide a Name for the Address Object (I recommend hostname of your Wazuh instance) and select the Zone Assignment (e.g., LAN).
- Choose the Type as Host and input the IP Address.
- Click ADD to save the Address Object.
Step 2: Configuring Syslog Forwarding on SonicWALL Firewall
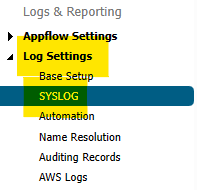
- From within the SonicWALL https management page, go to Manage > Log Settings > SYSLOG.
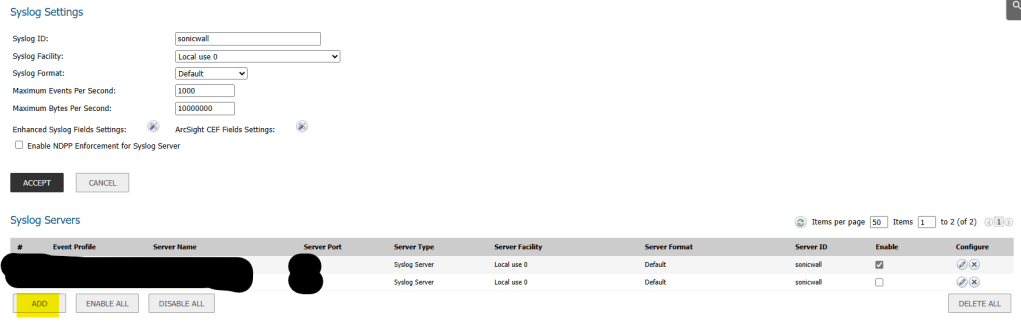
- Under Syslog Servers, click ADD.
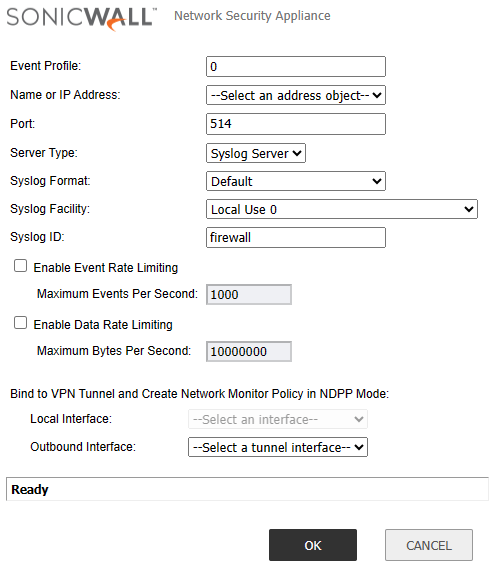
- In the Wizard pop-up window, set the Event Profile to 0.
- Select the previously created Address Object from the Name or IP Address drop-down menu.
- Assign port 514 (standard syslog port) and choose syslog server as the server type.
- Leave syslog format as Default and set syslog facility to Local Use 0.
- Set syslog ID to sonicwall and click OK to complete the configuration.
Step 3: Configuring Wazuh Manager to Receive Syslog
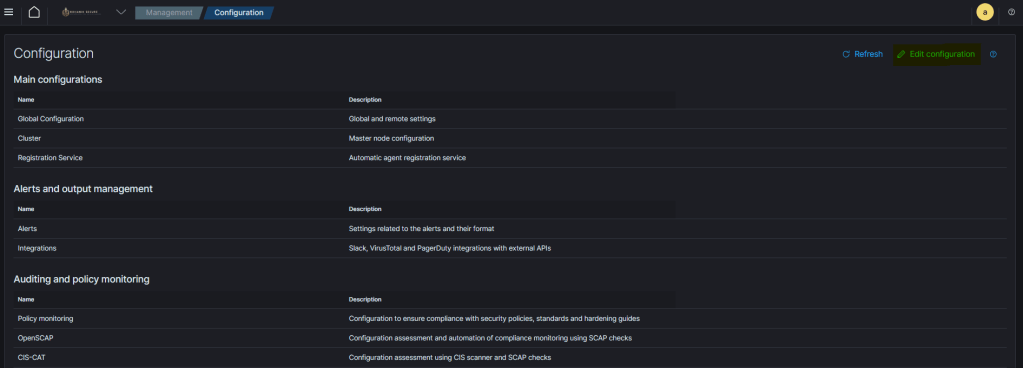
- Navigate to your Wazuh server dashboard and select Management > Configuration > Edit Configuration.

- Within the
<ossec_config>tag, input the following configuration:
<remote>
    <connection>syslog</connection>
    <port>514</port>
    <protocol>udp</protocol>
    <allowed-ips>10.10.10.1/24</allowed-ips>
    <local_ip>10.10.10.15</local_ip>
</remote>
- Replace
10.10.10.15with your Wazuh server’s IP address. Also, specify the subnet/IP address of your Sonicwall device within the allowed IPs script tag. - Next, within the global script tags, locate the
<logall>and<logall_json>tags. - Change both values from “no” to “yes”.

- Click Save and restart the Wazuh manager to apply the new configuration.
Before continuing on:
At this stage, your syslog pipeline should be operational, with data flowing from your SonicWALL firewall to your Wazuh SIEM. However, you may notice that alerts are not appearing in the OpenSearch Dashboards discover tab. This is because of two things…
- When you setup syslog receival in wazuh, all logs are ingested via the Wazuh Manager, so all alerts appears as your wazuh managers hostname/agent name.
- The default ruleset for Sonicwall syslog within wazuh has a high threshold to trigger an alert, therefore unless any logs are of high/critical importance we won’t be able to properly analyze/investigate our network traffic for threats.
To continue on, there is several options which I will also show how to do…
- The first thing I chose was to setup a dedicated host in between the sonicwall and wazuh. A syslog server. It’s purpose is to simply ingest and forward the syslog traffic to wazuh from the sonicwall. This way the sonicwall’s events have a dedicated agent within wazuh and we can sort and visualize the data accordingly in our dashboard to hone in on sonicwall log data.
- The second thing I chose to do was modify the syslog alerting directly on my sonicwall firewall to adjust the threshold of alerts being forwarded and reduce redundant false positive alerts.
- Lastly, I also tuned and modified the wazuh default ruleset for sonicwall syslog to create alerts based on lower log severity levels.
Step 4 (OPTIONAL): SeTTING UP A DEDICATED SYSLOG SERVER FOR FORWARDING
Setting up a dedicated syslog server for forwarding allows for better organization and management of syslog traffic from the SonicWALL within Wazuh.
- Set up an additional endpoint/server to handle the forwarding of syslog traffic. For my example, I spun up an Ubuntu server.
- Install rsyslog (can be substituted for logstash if using a windows endpoint/server)
sudo add-apt-repository ppa:adiscon/v8-devel
sudo apt-get update
sudo apt-get install rsyslog - Edit the
rsyslog.conffile by running:
sudo nano /etc/rsyslog.conf- Uncomment the following lines to enable UDP syslog:
$ModLoad imudp
$UDPServerRun <PORT>
- Replace
<PORT>with the applicable port, such as 514. - At the bottom of the file, add the following code snippet to forward syslog events to a specific file on the host:
if $fromhost-ip startswith 'REMOTE_DEVICE_IP' then /var/log/<FILE_NAME.log>
& ~
- Replace
REMOTE_DEVICE_IPwith your SonicWALL’s IP address and specify the file name where logs will be stored. - Navigate to your Wazuh dashboard, go to Agents > Deploy new agent, select the appropriate operating system, input the IP of the Wazuh manager, name the agent, and copy-paste the agent installation script onto your syslog machine.
- Once the agent is deployed and operational in the Wazuh dashboard, navigate to the agent config file. By running:
sudo nano /var/ossec/etc/ossec.conf- Scroll down to the
<localfile>section and paste the following configuration:
<localfile>
<log_format>syslog</log_format>
<location>/var/log/<FILE_NAME.log></location>
</localfile>- Replace the file path within the
<location>tags with the correct path to your earlier specified log file. - Save the file, and restart the Wazuh agent and rsyslog service on the machine:
systemctl restart rsyslog
systemctl restart wazuh-agent- Repeat Part 1: Steps 1 & 2, but with your newly setup host receiving the Sonicwall syslog.
At this point, your SonicWALL firewall now has a buffer machine with a dedicated Wazuh agent, allowing for easier focused threat hunting. If you choose not to do this you can always sort and visualize the data by filtering by decoder.name = sonicwall. Another thing to note is that you may want to invest time automating the clearing of the log file periodically to avoid your storage from becoming full on the syslog forwarding machine. Depending on your configuration thousands of logs may be generated in minute(s)/second(s).
PART 2: FINELY TUNING ALERTING AND RULESETS
Step 5 (OPTIONAL): FINE TUNING SONICWALL SYSLOG ALERTING
Modifying SonicWALL alerts generated via syslog is customizable and very simple:
- On your SonicWALL HTTPS management page, navigate to Manage > Log Settings > Base Setup.

- In the top left, adjust the logging level dropdown menu to your preference.
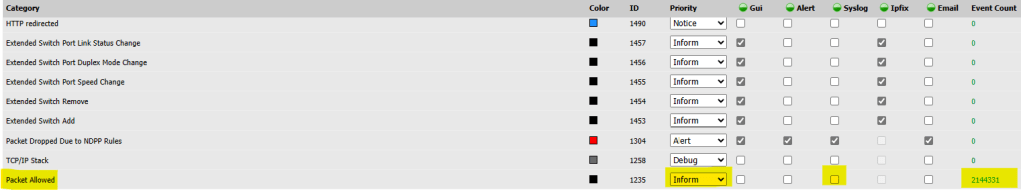
- Review the different categories of logs and their event counts to identify redundant alerts. I suggest monitoring your network traffic for a set timeframe to ensure any alerts you disable are actual false positive’s and not necessary in your specific instance.
- Uncheck syslog from alerting for redundant alerts. For example, under Network > Network Access > Packet Allowed, consider adjusting the log level or disabling syslog alerting. By default the category of this alert is simply inform. Under wazuh’s default ruleset inform logs are simply discarded and ignored, if something such as packet allowed is important to you simply change the log level to alert/emergency, and by wazuh’s default ruleset an alert will be generated for review.
- Save your changes.
Step 6 (OPTIONAL): FINE TUNING WAZUH’S DEFAULT SONICWALL RULESET
Customizing Wazuh’s default ruleset for SonicWALL syslog messages allows for fine-tuning security monitoring and prevention:
- Execute
sudo nano /var/ossec/ruleset/0080-sonicwall_rules.xmlto access the default ruleset.
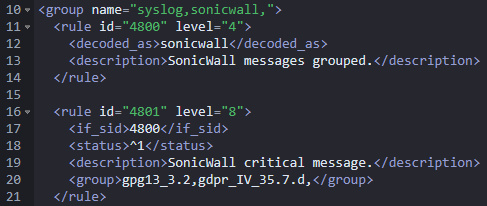
- Review the default rules and their alerting levels.
- Adjust the alerting levels according to your requirements. Change rules to level 3 or higher for visibility within Wazuh.
- Save the file.
It’s important to note that while modifying the default ruleset is possible, it’s recommended to create custom rules to avoid changes being reverted during updates. To access the custom rules instead ensure you use the overwrite script tags and navigate instead to /var/ossec/etc/rules/.
PART 3: VISUALIZING THE SYSLOG DATA
Step 7 (OPTIONAL): LET’s visualize our sonicwall on a Threat map!
In this step, we’ll guide you through creating a threat map to visualize the IP GEO locations alerted on your SonicWALL firewall. This visualization will provide valuable insights into the geographic origins of network events, enabling you to identify patterns and potential threats.
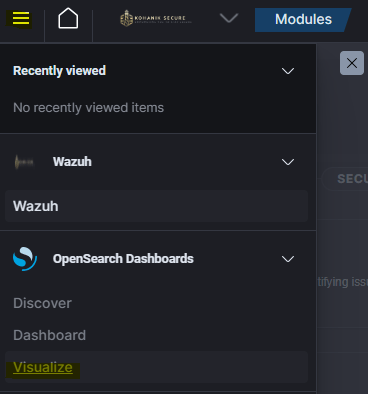
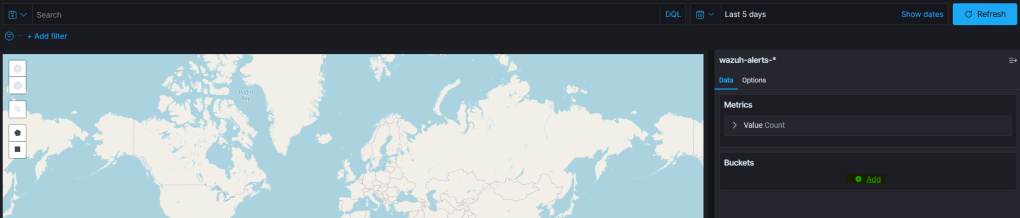
- Navigate to your Wazuh portal and access OpenSearch Dashboards by selecting Menu > OpenSearch Dashboards > Visualize.
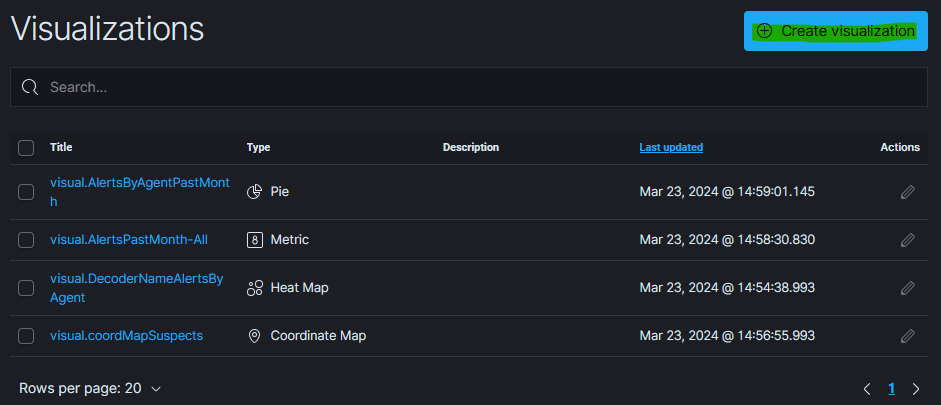
- In the Visualize section, click on Create visualization.
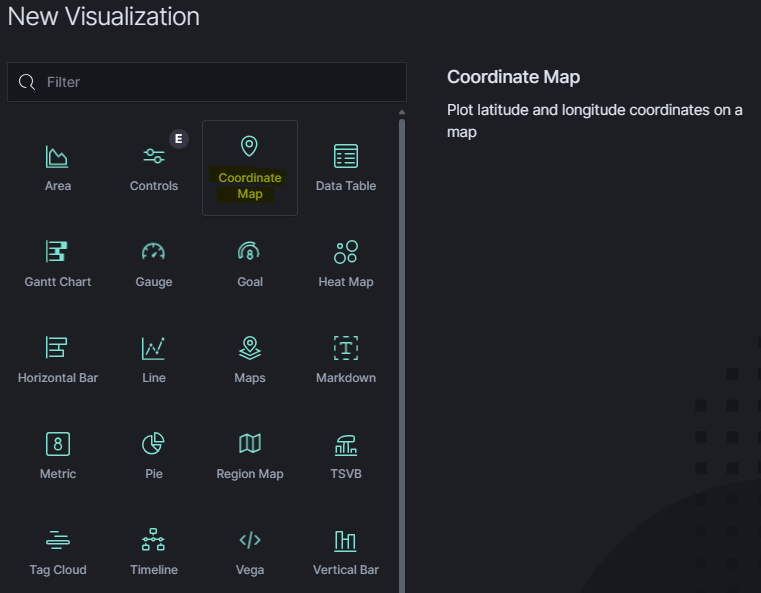
- In the “New Visualization” pop-up, select Coordinate Map as the visualization type.
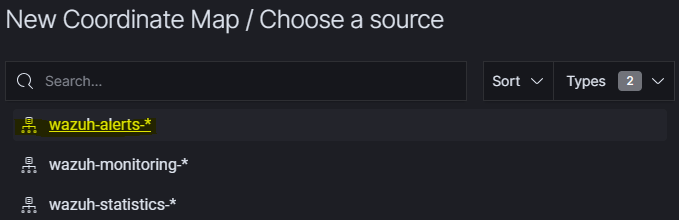
- Choose “wazuh-alerts-*” as the data source for the coordinate map.
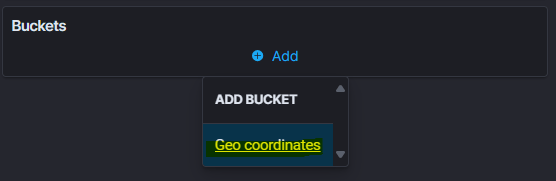
- Once you see the blank map, simply add a bucket by selecting Add + under buckets on the right-hand side.
- Choose Geo coordinates from the drop-down menu.
- For the Aggregation option, select Geohash.

- Select GeoLocation.location as the Field.
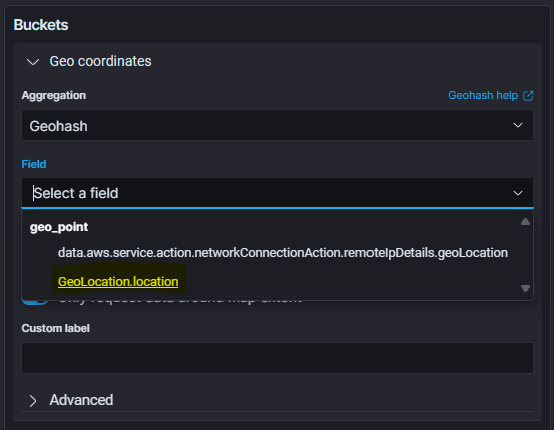
- Customize labels or configurations according to your preference.
- Save the visualization with a custom name for future reference.
- To access your custom map visualization later, navigate to Menu > OpenSearch Dashboards > Visualize.
- You can create queries on a visualization from the top toolbar to filter results based on specified time ranges or rules, allowing you to pinpoint the geographic origin of offenders’ IP addresses triggering alerts on the SonicWALL/Wazuh.
Example: Identifying Bad Actors
As discussed earlier in the article, I was able to uncover many different potential threats occurring over a few days time. In the visualizations below, I observed 631 instances of an IP address with a specific Geo Location attempting something on the SonicWALL firewall. Let’s dive deeper into this…
- See a blip on the map? Go run a query in the OpenSearch Dashboards Discover tab, narrowing down the results to
decoder.nameas “sonicwall” andGeoLocation.country_nameas whatever identified country name appears on your heatmap. - Upon investigation, I discovered that a “user” was attempting to log in with non-existent or incorrect credentials to a publicly facing login page for the SSLVPN service, and attempted it 631 times.
To mitigate the identified threats and reduce the risk of unauthorized access, I implemented the following measures:
- Lowering Lockout Attempt Thresholds: I lowered the lockout thresholds for login attempts to the SonicWALL VPN service. As well as increased the lockout time-out. By reducing the number of allowed login attempts, I effectively stop brute-force attacks and unauthorized access attempts.
- Implementing GEO-IP Filtering: Utilize GEO-IP filtering to restrict access to your network resources based on the geographic location of IP addresses. By defining allowed and blocked countries or regions, you can effectively control inbound and outbound traffic, limiting exposure to potential threats originating from high-risk geographic locations. This proactive measure helps mitigate the risk of unauthorized access and strengthens your network security posture by reducing the attack surface available to malicious actors.
- Utilizing OSINT Data: Leveraging Open-Source Intelligence (OSINT) data, I narrowed down the threat actors’ Internet Service Providers (ISPs). This can allowed one to report the malicious IP addresses for abuse and gather additional information on the hosts involved. By collaborating with ISPs and sharing threat intelligence, it contributes to the broader cybersecurity community’s efforts to combat malicious activities.
Conclusion
By following the steps outlined in this guide, you’ve gained the ability to proactively monitor and analyze network traffic, empowering you to identify and respond to potential security threats swiftly. Whether it’s detecting unauthorized access attempts, stopping malicious activities, or mitigating risks through strategic measures, you now have the tools and knowledge to fortify the network security of your infrastructure.
Remember, effective log management is a cornerstone of modern cybersecurity practices. By harnessing the power of syslog forwarding, SIEM technologies, and visualization tools, you can stay one step ahead of cyber threats and safeguard your organization’s digital assets. Feel free to comment or message me any questions, if you need assistance setting this up within your own environment! I am happy to help!
Thank you for joining me on this journey to bolster network security through effective log management. Together, we’re building a safer and more resilient digital world.
